 |
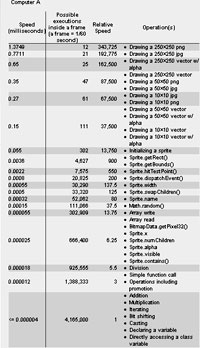
A speed comparison across all trials. If you would like to view the full results they are available in cvs, htm, and xls formats. |
Computer A
| Speed (milliseconds) |
Possible executions inside a frame (a frame = 1/60 second) |
Relative Speed | Operation(s) |
|---|---|---|---|
| 1.3749 | 12 | 343,725 |
|
| 0.7711 | 21 | 192,775 |
|
| 0.65 | 25 | 162,500 |
|
| 0.35 | 47 | 87,500 |
|
| 0.27 | 61 | 67,500 |
|
| 0.15 | 111 | 37,500 |
|
| 0.055 | 302 | 13,750 |
|
| 0.0036 | 4,627 | 900 |
|
| 0.0022 | 7,575 | 550 |
|
| 0.0008 | 20,825 | 200 |
|
| 0.00055 | 30,290 | 137.5 |
|
| 0.0005 | 33,320 | 125 |
|
| 0.00032 | 52,062 | 80 |
|
| 0.00015 | 111,066 | 37.5 |
|
| 0.000055 | 302,909 | 13.75 |
|
| 0.000025 | 666,400 | 6.25 |
|
| 0.000018 | 925,555 | 5.5 |
|
| 0.000012 | 1,388,333 | 3 |
|
| <= 0.000004 | 4,165,000 | 1 |
|
Computer D
| Speed (milliseconds) |
Possible executions inside a frame (a frame = 1/60 second) |
Relative Speed | Operation(s) |
|---|---|---|---|
| 0.3 | 55 | 75,000 |
|
| 0.2 | 83 | 50,000 |
|
| 0.17 | 98 | 42,500 |
|
| 0.125 | 133 | 31,250 |
|
| 0.1 | 167 | 25,000 |
|
| 0.05 | 333 | 12,500 |
|
| 0.04 | 416 | 10,000 |
|
| 0.018 | 926 | 4500 |
|
| 0.0016 | 10,417 | 400 |
|
| 0.00107 | 15,567 | 267.5 |
|
| 0.00042 | 39,683 | 105 |
|
| 0.00032 | 52,062 | 80 |
|
| 0.000062 | 268,817 | 15.5 |
|
| 0.000030 | 555,555 | 7.5 |
|
| 0.000025 | 666,400 | 6.25 |
|
| 0.000012 | 1,388,333 | 3 |
|
| <= 0.000004 | 4,165,000 | 1 |
|
This table does not have the results from every trial; it would particularly do a disservice to the trials with significant overhead. Nor does this table address optimizations or alternatives that you can implement. However, a relative comparison across the bulk of the trials puts cost in perspective. The 19 most expensive operations are all concerning graphics. Due note that the speed at which vectors are drawn is based on graphic complexity – not size. These vector objects were squares, so the render speed should be a minimum. Conversely, png and jpg render speed is based on image size regardless of contents so its speed should be constant.
Optimization practices and an appropriate art strategy should be planed from the beginning of any project. At the same time, we live in an imperfect world and work under changing demands. If a project’s performance starts to decrease during development, the most efficient optimizations you can make are to your graphics. With experience, you will get better at striking the balance between optimizing artwork and ActionScript. Inevitably, performance bugs will happen, hopefully now you should be able to quickly diagnose the problem and be able to implement some alternatives.
Thanks for reading, and remember, we are all in this together.
This post is part of a series:
Introduction
Methodology
Operation Speed
Data Structure Speed
Graphics Speed
Results <– You are here
 |
|
Comment by Baz — July 13, 2009 @ 11:19 pm
You did a huge work.
I have learnt a lot and have many things to put in practise now.
Thanks a lot for sharing.
Comment by Igor — April 2, 2011 @ 10:42 am
Thanks, man!
Reading this was REALLY helpful!
Comment by man — May 17, 2012 @ 7:53 am
thank you very much for your time! =*^_^*=
Comment by benjamin guihaire — August 6, 2013 @ 8:56 am
for AS3 profiling, the best is to use adobe Scout, its also good to know AS3 best practices in general while coding, and look at optimizations techniques over internet (see my blog: http://www.guihaire.com/code)